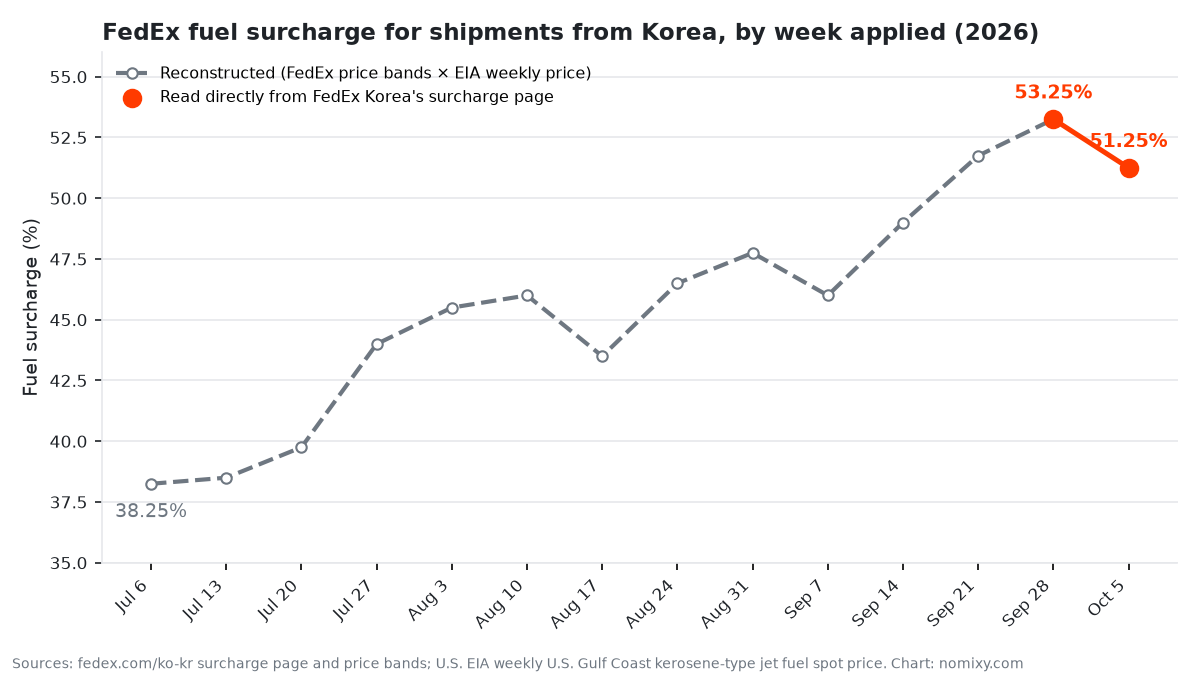
If you ship internationally from Korea with FedEx, one line on the invoice changes every Monday: the fuel surcharge. For the week of September 28, 2026 it was 53.25%. For the week of October 5, FedEx posted 51.25%. In early July, by my reconstruction, it was 38.25%.
FedEx Korea’s surcharge page only shows the current week, so there is no official history to look back on. I rebuilt the past quarter from public data, checked the method against the live page, and now log the number every week. Below is the data, how FedEx sets the rate, and how to work out next week’s rate yourself.
Why I Started Tracking It
Every shipment I send abroad goes out with FedEx, so the surcharge goes straight into what each one costs. When I wanted to see how it had moved over the summer, I found that FedEx Korea’s surcharge page shows a single row: the current week, its fuel price, and its rate. There’s no archive and no link to past weeks.
So I did two things. I rebuilt the past weeks from data that is public, and I had my AI browser agent start recording the official rate every Monday. The first gives me a quarter of history. The second means I never have to rebuild it again.
The Data: 14 Weeks, July 6 to October 5, 2026
The table shows each week the rate applied, the U.S. Gulf Coast jet fuel price it was based on, and where each number comes from. I read the last two rows directly from FedEx’s page. The rest are reconstructed, using the method described below.
| Week applied | USGC jet fuel ($/gal) | EIA week ending | Surcharge | Change (pts) | Source |
|---|---|---|---|---|---|
| Jul 6 | 2.788 | Jun 26 | 38.25% | — | Reconstructed |
| Jul 13 | 2.816 | Jul 3 | 38.50% | +0.25 | Reconstructed |
| Jul 20 | 2.971 | Jul 10 | 39.75% | +1.25 | Reconstructed |
| Jul 27 | 3.497 | Jul 17 | 44.00% | +4.25 | Reconstructed |
| Aug 3 | 3.676 | Jul 24 | 45.50% | +1.50 | Reconstructed |
| Aug 10 | 3.736 | Jul 31 | 46.00% | +0.50 | Reconstructed |
| Aug 17 | 3.431 | Aug 7 | 43.50% | −2.50 | Reconstructed |
| Aug 24 | 3.770 | Aug 14 | 46.50% | +3.00 | Reconstructed |
| Aug 31 | 3.922 | Aug 21 | 47.75% | +1.25 | Reconstructed |
| Sep 7 | 3.715 | Aug 28 | 46.00% | −1.75 | Reconstructed |
| Sep 14 | 4.082 | Sep 4 | 49.00% | +3.00 | Reconstructed |
| Sep 21 | 4.418 | Sep 11 | 51.75% | +2.75 | Reconstructed |
| Sep 28 | 4.584 | Sep 18 | 53.25% | +1.50 | FedEx page |
| Oct 5 | 4.351 | Sep 25 | 51.25% | −2.00 | FedEx page |
Between the weeks of July 6 and September 28, twelve weeks, the rate rose 15 percentage points, from 38.25% to 53.25%, before easing to 51.25% in October. It wasn’t a smooth climb. The rate fell 2.5 points in the week of August 17 and 1.75 points in the week of September 7, and both times it jumped 3 points the following week.
How FedEx Sets the Number
The mechanics are all on FedEx’s own page. They just aren’t spelled out in one place:
- The input is a public price. The rate is based on the weekly average U.S. Gulf Coast spot price of kerosene-type jet fuel, which the U.S. Energy Information Administration publishes.
- Price bands map it to a percentage. FedEx Korea publishes a table of price bands. Each $0.03-per-gallon band moves the surcharge by 0.25 points. For example, $4.34–$4.37 is 51.25% and $4.58–$4.61 is 53.25%.
- It changes every Monday. The new rate applies from Monday and shows up on FedEx invoices.
- There’s a lag. FedEx notes that the rate can trail the fuel index by about two weeks. In practice, every week in my table uses the EIA price for the week ending on the Friday about ten days before the Monday it applies.
- It applies to almost everything. All FedEx services except International Express Freight (IXF) and International Airport-to-Airport (ATA), which have their own rates. It’s added to the net freight charge and to certain other surcharges, such as residential delivery and address correction.
Checking the Method Against FedEx’s Own Number
A reconstruction is only useful if it reproduces what FedEx actually publishes, so I checked it on the newest week. EIA’s price for the week ending September 25 was $4.351 a gallon. That falls in FedEx’s $4.34–$4.37 band, which maps to 51.25%. I worked that out first, then opened FedEx Korea’s page on October 1: the rate posted for October 5–11 was $4.351 and 51.25%.
One match isn’t proof, and FedEx can change its band table at any time. But it’s good evidence that the method works, and it means the surcharge is predictable: once EIA publishes the weekly price, you can work out the rate it leads to yourself.
What a 15-Point Swing Means If You Sell Internationally
I’m not going to share my own rates, but the surcharge math doesn’t need them. On the same net freight charge, the freight-plus-fuel total at 53.25% is about 11% higher than at 38.25% (1.5325 ÷ 1.3825 ≈ 1.11). The October drop to 51.25% takes about 1.3% back off that total.
For a small seller, that’s enough to matter:
- Put a date on every shipping estimate. A number without a week attached can be wrong by the time the box ships.
- Review fixed shipping prices on a schedule. If you charge customers a flat international shipping fee, a quarter like this one can quietly eat into what you keep from each order.
- Watch the direction, not just the level. Because the rate follows a public price with a lag, you can see a move coming about a week before it lands.
Method and Limits
- Two rows are observed, twelve are reconstructed. I read 53.25% (week of September 28) and 51.25% (week of October 5) directly from FedEx Korea’s page. The other twelve weeks apply FedEx’s current price-band table to EIA’s weekly prices.
- The band table could have changed. The reconstruction assumes FedEx used the same table all quarter. If it changed, the older rows could be off. Where a price sits exactly on a band edge (the week of August 24), I used the band that starts at that price, since FedEx’s table lists the minimum of each band.
- This isn’t FedEx data. It’s my own record, built from FedEx’s public page and EIA’s public series. For billing questions, FedEx’s page and your invoice are the source of truth.
- No contract rates here. The surcharge is a public percentage. Account-specific rates aren’t part of this.
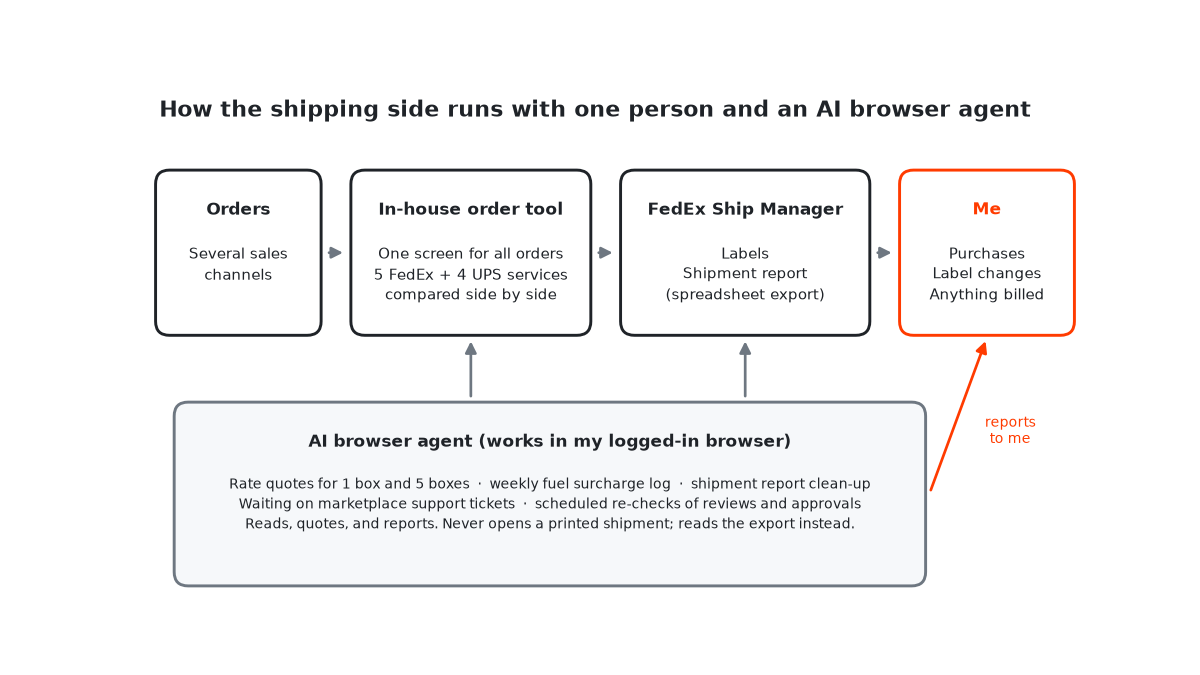
From here on, the table grows by one observed row each week. If you want to see how the rest of the shipping side runs, I wrote up how I run international shipping alone with an AI browser agent.